|
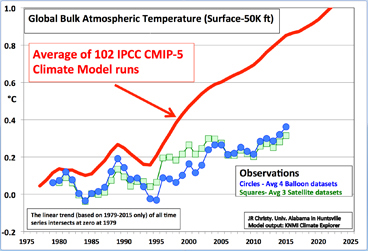
Five-year
averaged values of annual mean (1979-2015) global bulk (termed
“midtropospheric” or “MT”) temperature as depicted by the average of 102 IPCC
CMIP5 climate models (red), the average of 3 satellite datasets (green - UAH,
RSS, NOAA) and 4 balloon datasets (blue, NOAA, UKMet, RICH, RAOBCORE). |
On February 2, 2016 Dr. John Christy, a leading climate scientist, gave testimony before the House Committee on Science, Space and Technology Committee. In it he presented peer-reviewed research on the datasets used by NOAA. These data don’t support the fear-laden pronouncements of global doom if we don’t stop carbon emissions. It is stunning. You can download the testimony here or by clicking on the graphic above.
|
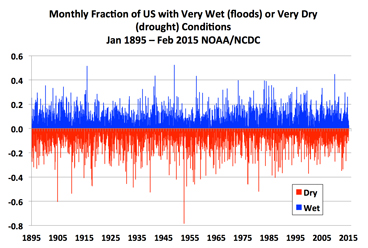
Areal fraction of conterminous
U.S. under very wet (blue)
or very dry (red) conditions. NOAA/NCEI. |
That’s not all. Christy’s testimony is too long to review in this blog, but two other things stand out. First, as the 2nd figure shows, there has been no significant change in drought and flooding in the past 100 years. If anything, the frequency of drought and floods has declined since the late 1950s when global warming was happening.
Finally, and perhaps most importantly, food production has not been affected as is claimed by warming alarmists. Says Christy: “It is a simple matter to find documentation of the ever-rising production of grains. One wonders about the Federal Council on Environmental Quality’s allegation that there has been “harm to agriculture” from human-induced climate change because when viewing the total growth in production, which appears to be accelerating, one would assume no “harm” has been done during a period of rising greenhouse gases.” Enough said for now. Read the entire set of testimonies here. It is worth your time.
Michael Coffman


No comments:
Post a Comment